CRM
A section for analyzing funnel performance.
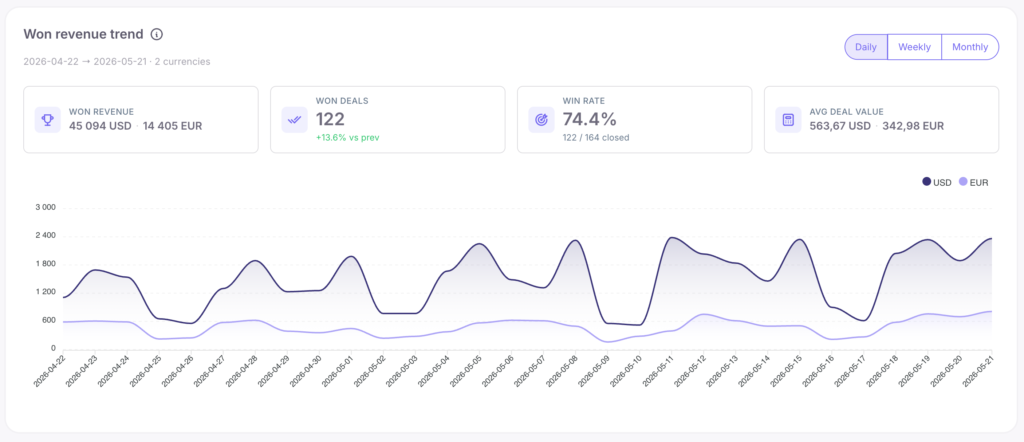
1. Won revenue trend
A chart with key metrics:
- Won revenue
- Won deals
- Win rate — the percentage of successful deals out of all closed ones (deals in progress are not counted).
- Avg deal value
How to use this data:
If the number of won deals grows but revenue remains unchanged, managers are focusing on cheaper plans. A drop in deal conversion signals low-quality ad leads or mistakes during the client qualification stage.

2. Win rate trend
A chart of the percentage of successful deals by weeks or months with an average value line.
How to use this data:
This is a great tool for tracking changes. If you implement a new sales script, check the chart in 2-3 weeks. A sharp drop usually indicates an isolated problem (bad traffic, absence of a key manager), while a gradual decline suggests the need for a global overhaul of procedures.
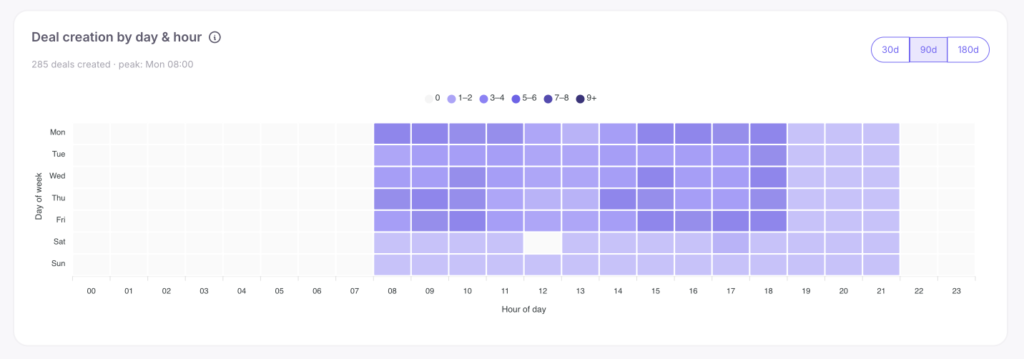
3. Deal creation by day & hour
A heatmap recording new deals in the CRM.
How to use this data:
The chart visualizes on which days and hours the highest number of deals are created (both automatically by the platform and manually). This allows you to clearly track the time of maximum new lead intake. Knowing these peaks, you can plan ad campaign launches more effectively. If you have a sales team, you can adjust your managers’ schedules so that during the hottest hours, all incoming requests are processed instantly before they “cool down.”
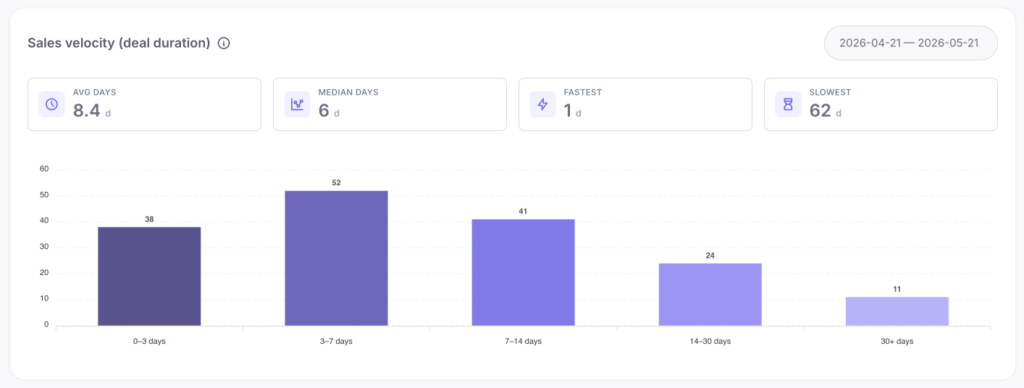
4. Sales velocity (deal duration)
The time spent advancing a deal from creation to payment. Metrics: average, median, record times (Fastest / Slowest), and a day-by-day histogram.
How to use this data:
A median of up to 7 days indicates fast sales. Values from 14 to 30 days are typical for the corporate segment (B2B). A median over 30 days points to prolonged processes (long approvals). A large “30+ days” group on the histogram means old deals have accumulated in the system and need to be either pushed forward or closed as lost.
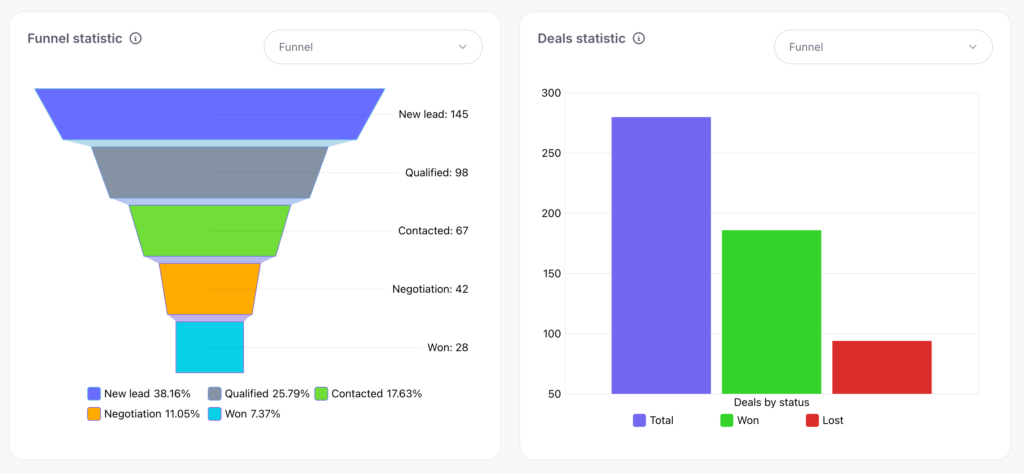
5. Funnel statistic / 6. Deal statistic
A chart showing the flow of leads through all stages of the sales funnel and a summary of the won/lost deals ratio.
How to use this data:
Look for stages with maximum drop-off. For example, if there are 40 deals at the “Demo” stage and only 5 made it to the “Contract” stage (an 87% loss), you need to investigate the cause (high price, non-target clients at the demo, or lack of a follow-up call).