Dashboards
In Softbook LMS, you can create your own custom dashboards for different roles (except students) or for specific users among administrators, teachers, or the owner.
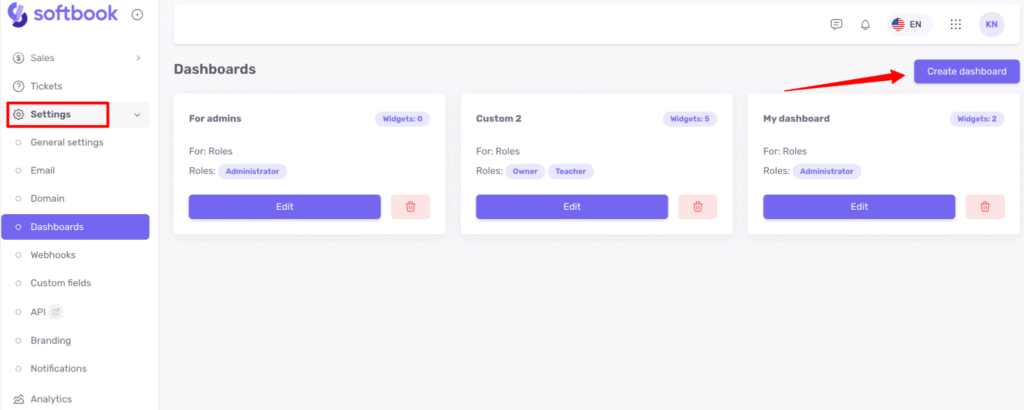
To configure dashboards, go to Settings → Dashboards and click Create dashboard.
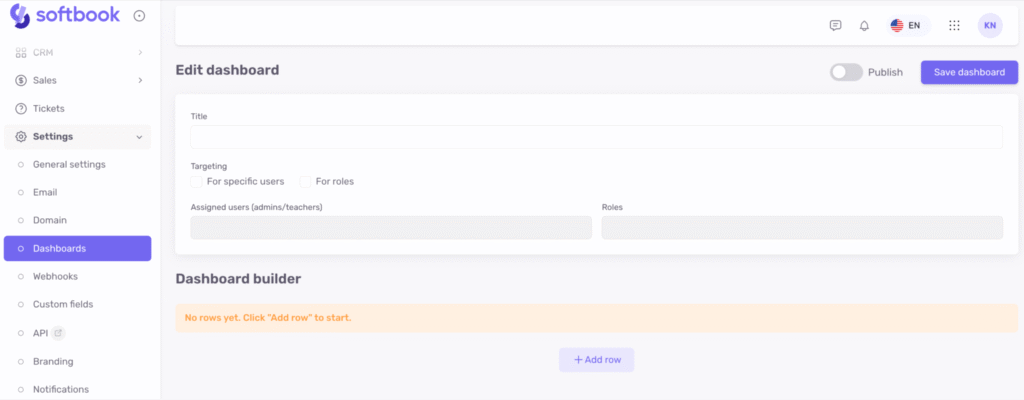
The dashboard settings will open. Here you need to enter the name of the dashboard in the appropriate field and choose who it will be for. There are two options: either for specific users or for certain roles.
- If you choose specific users, the Assigned users field will display the names of your administrators and teachers.
- If you choose roles, you can select them from the dropdown list — School Owner / Teacher / Team.
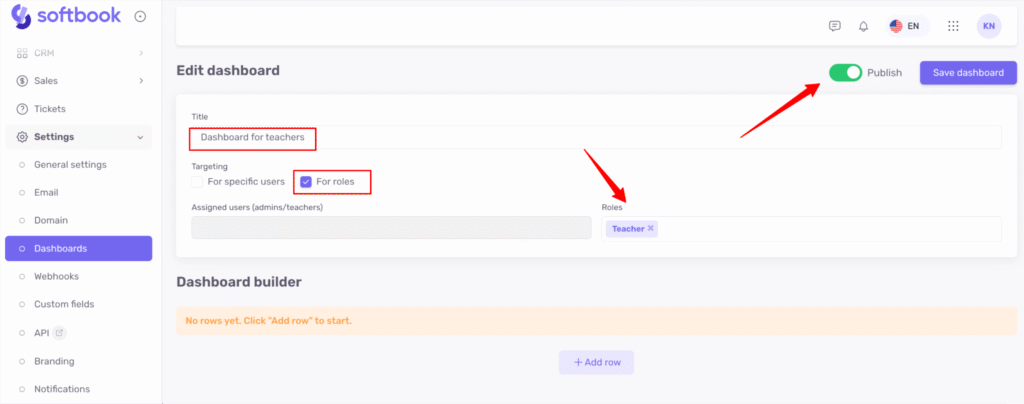
Let’s look at an example. Suppose you want to create a custom dashboard for the Teacher role. Enter the dashboard name, select “For roles”, and in the role list choose “Teachers.” Then activate toggle Publish.
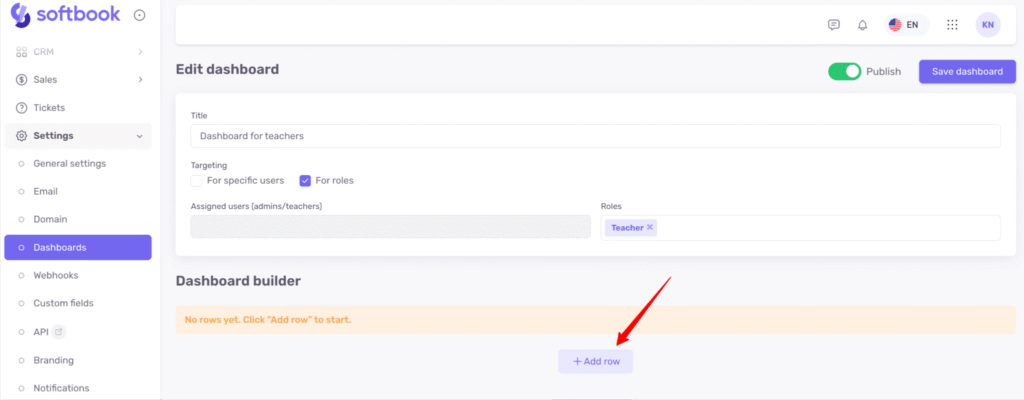
Next, click +Add row.
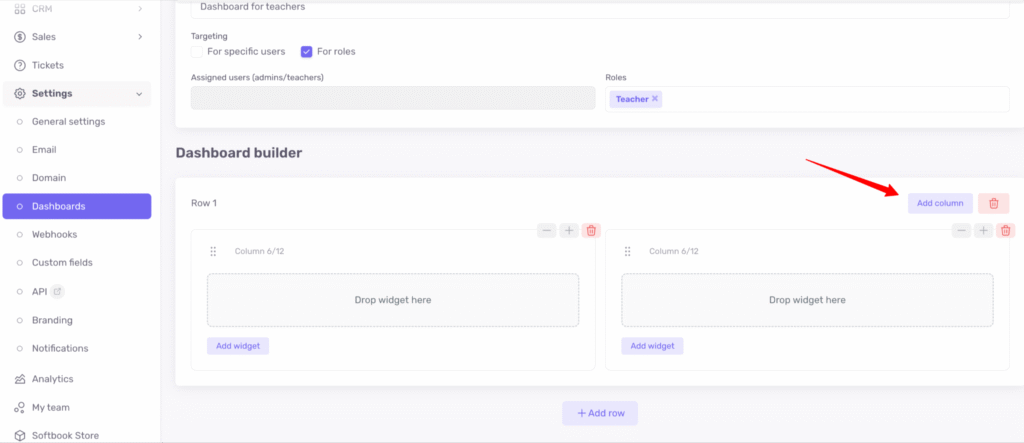
The builder of your dashboard will open. By default, two columns are created, but you can add more by clicking +Add column.
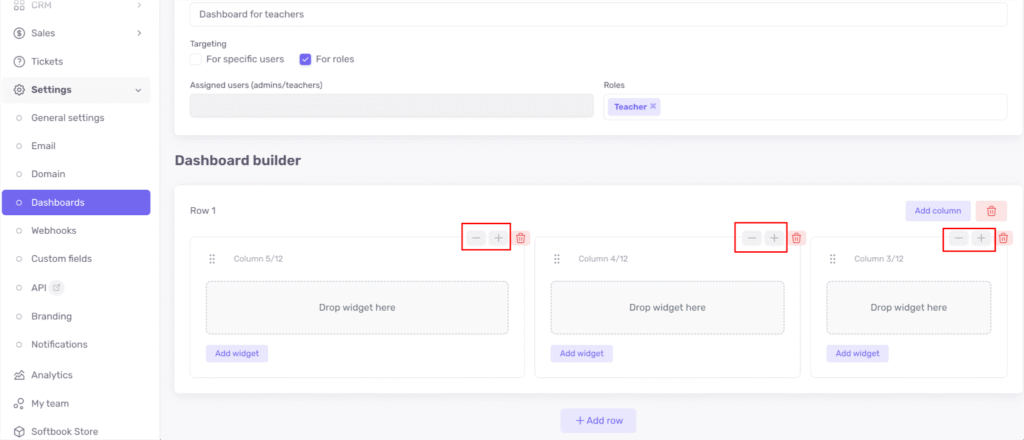
You can also adjust the width of each column by clicking “+” and “–.” The total width of all columns is always equal 12.
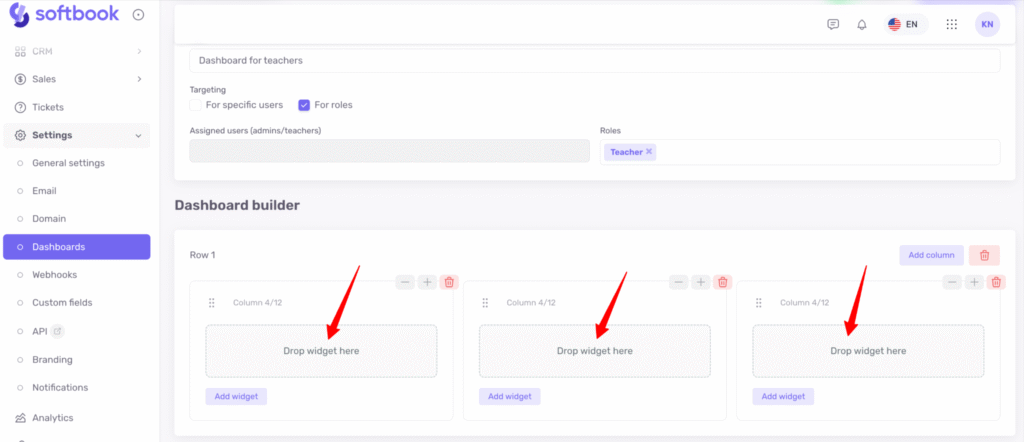
Now, you can add specific widgets (reports) to each column. To do this, click Drop widget.
A list of available reports will appear.
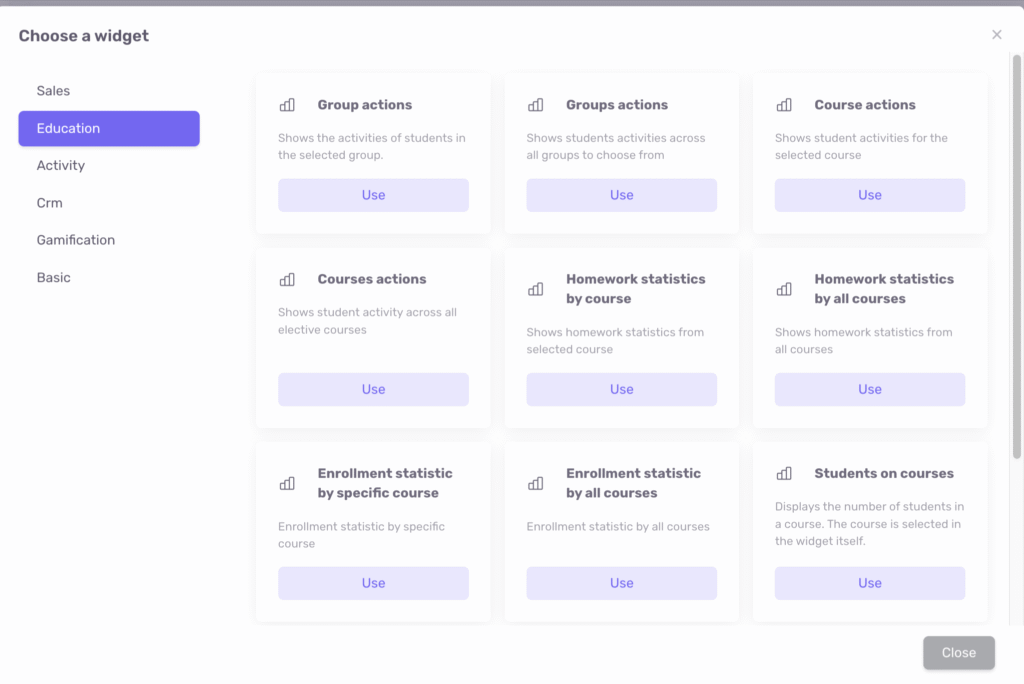
Report categories include:
- Sales
- Education
- Activity
- CRM
- Gamification
- Basic
Each category contains a specific set of reports. Select the one you need and click on it.
In the next window, additional options will appear depending on the selected report — for example, choosing a specific course or selecting how the report should be displayed: bar chart or radial chart. In the first case, the data will be shown as a bar chart; in the second — as a pie chart.
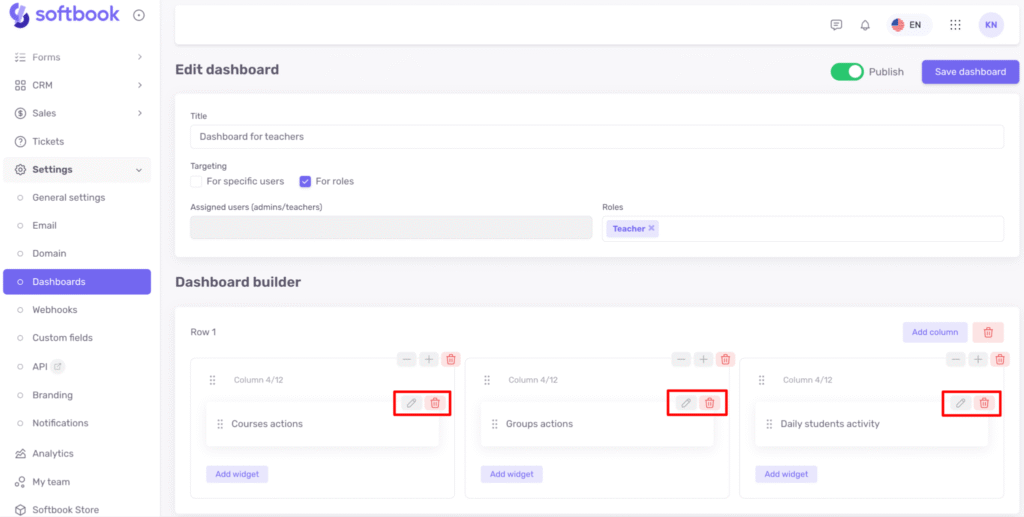
If you would like to delete or replace a widget, you can do this using the corresponding buttons.
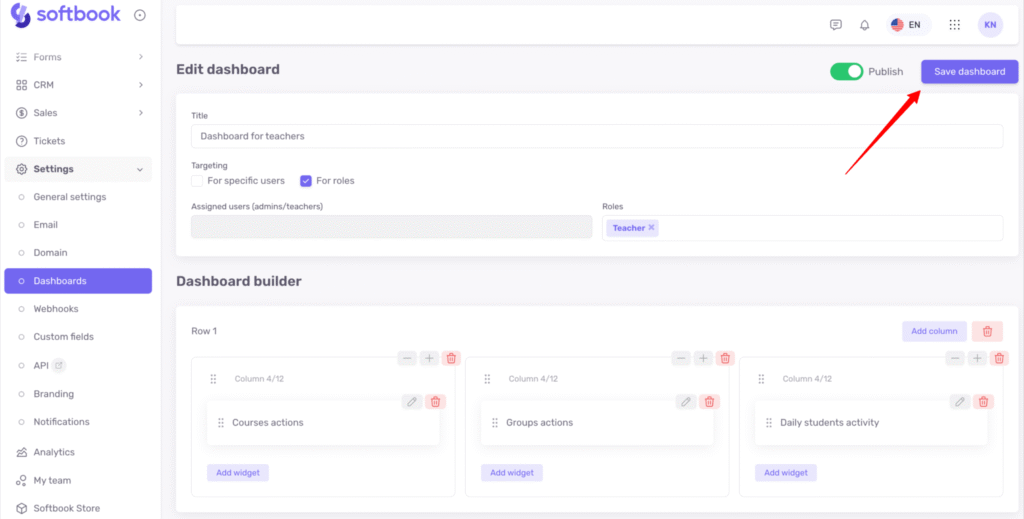
When you finish setting up your dashboard, click Save dashboard in the upper right corner.
Now, when you go to the main page of your school in the Dashboards section, you can select the newly created dashboard in the bottom right corner, and the reports you configured will appear on the screen.
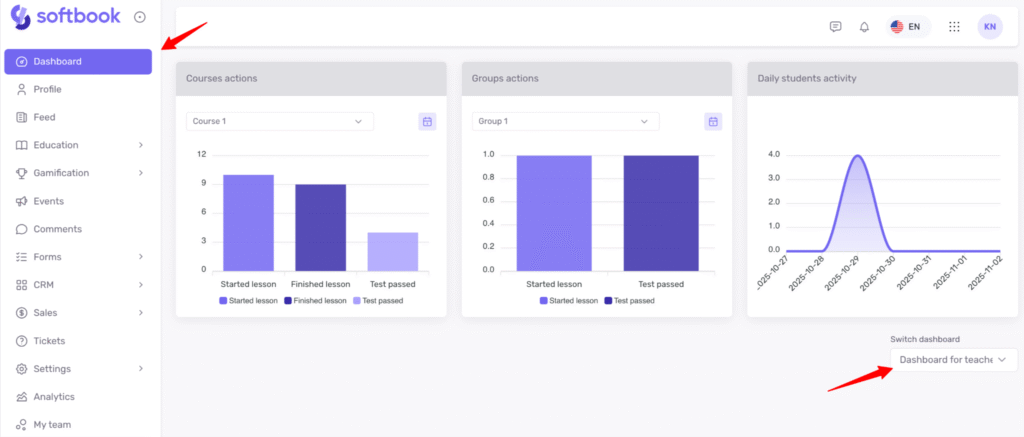
If you don’t like how the reports are displayed, you can always go back to the settings and adjust the appearance or number of widgets in a row.
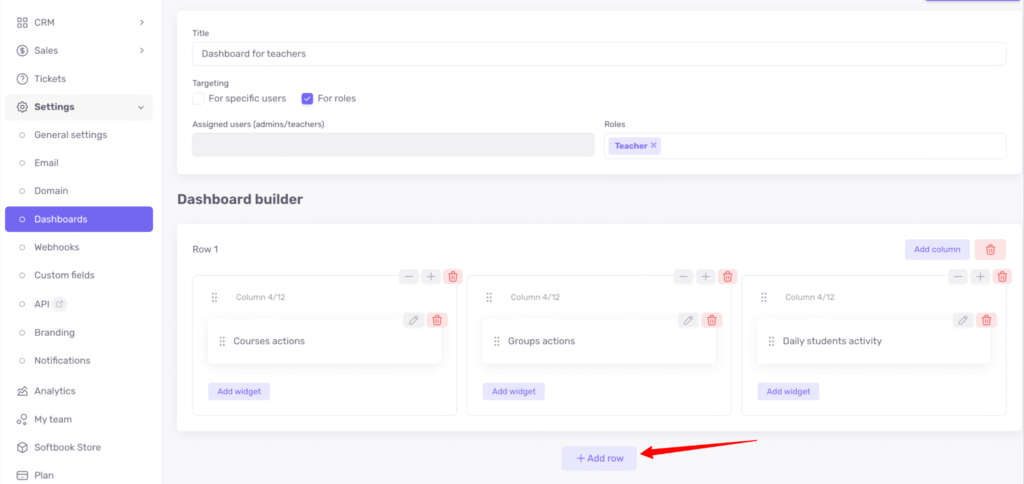
You can also add multiple rows of widgets. To do this, click +Add row and configure the number of widgets, their width, and their content in the same way.
Done! Now you know how to set up custom dashboards.